My Flight Prediction Tutorial
IMPORTANT
This tool provides a prediction only. It creates a prediction based off the GFS (Global Forecast System) and the data you provide. As with any weather predictions, the GFS is not always accurate. This system also relies on the user to provide accurate inputs based off your own flight performance calculations (ascent/descent rates, burst altitude, etc.) and experience. If you give MyFlightPredictor incorrect data, it will give you an incorrect prediction.
It is always best to plan with the end goal in mind. With weather balloon launches, plan where your want your payload to land. This should be an area that is not populated, free of large bodies of water, and difficult terrain. If possible, pick an area that does not have a lot of forest either. Bad landing locations would include mountainous terrain, remote deserts, large dense forests, or populated areas. Once you have determined where you want your payload to land, then move your launch site and run the flight prediction engine multiple times until the landing location matches the landing area you have selected. Even if it creates what appears to be an impossible challenge, do whatever it takes to move your launch site. If you can’t move your launch site, only then, as a very last resort, move your launch date/time so that your predicted flight path is favorable (does not fly over populated areas or land in terrain that is difficult to access). If you can’t be flexible with your launch date and location, then be prepared to cancel your launch if your payload is predicted to fly over populated areas.
Make sure you research and follow all local, state, and federal laws when launching a weather balloon.
How it Works
The MyFlightPredictor engine connects to the GFS (Global Forecast System). The GFS estimates wind, temperature, humidity, and density data for the entire planet multiple days in advance. Our proprietary software algorithms analyze this data and compute a prediction about the flight path of your balloon. Keep in mind that the GFS makes predictions. A prediction run three days in the future will not be as accurate as a prediction run 6 hours in the future.
Step 1 - Gather Data
Gather all the information you need for the launch. The required information includes:
Launch site date and time
Launch site location (latitude, longitude, and elevation)
Flight performance (ascent rate, descent rate, burst altitude).
We will go through how to easily determined all this information as we progress though this tutorial.
Step 2 - Enter Date and Time in GMT
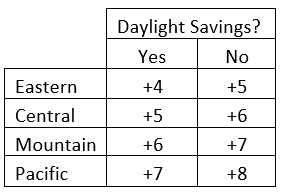
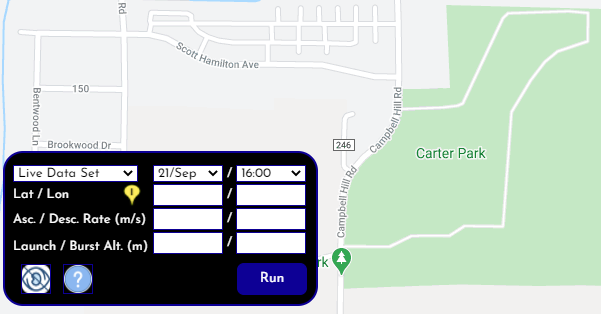
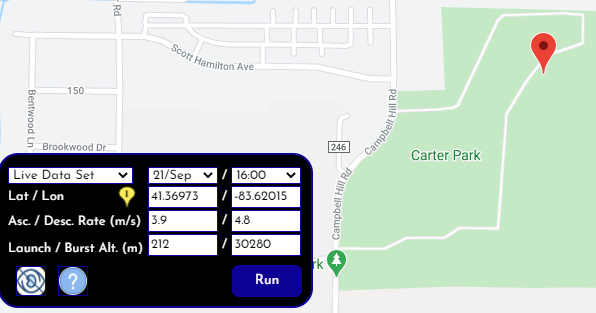
Select the launch date and time you wish to launch from the drop-down menu. Note that the date/time is Universal/GMT/Zulu time. Using GMT simplifies flight planning, especially when your flight may cross one or more time-zones. It’s the same time standard NASA, pilots, as well as the military uses for coordinating flights and missions. You can use the above chart to convert your local time to UTC. For instance, if you are in the Eastern Time Zone in the summer and your state uses daylight savings (Daylight Savings = Yes), simply add +4 hours to your local time to get your GMT time. If you plan to launch at 12:00 noon Easter Daylight Time, the launch would occur at 16:00 GMT. In our example we plan to launch on 21/Sep at 16:00 GMT.
Step 3 - Set Your Launch Location
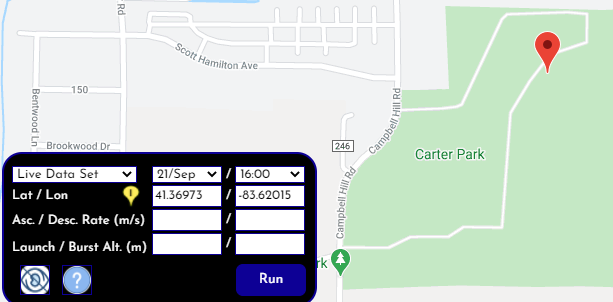
If you know your launch site Latitude and Longitude, enter it into the “Lat / Lon” box. An even easier method of setting your launch site is to pan / zoom on the map using your mouse until you have found your intended launch site. Click the yellow “i” icon next to the “Lat / Lon” and then click on the map where you intend to launch. A red pin will appear on the map indicating your launch site and the “Lat / Lon” values will auto populate. In the example below, we clicked on the yellow “i” icon and then clicked on Carter Park in Bowling Green, OH which dropped the red pin on Carter Park.
Step 4 - Enter Flight Performance Data
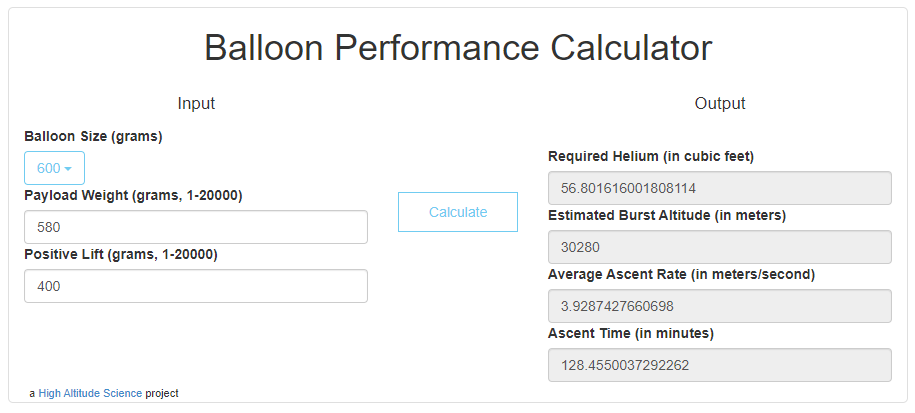
Enter your launch site elevation and flight performance data. Our launch site is in Bowling Green, Ohio. We can simply google “Bowling Green, Oh elevation” and google responds with 696 ft or 212 meters so we enter 212. Our ascent rate and estimated burst altitude comes from the High Altitude Science Balloon Performance Calculator. For our example we are launching a 580 g payload using a 600 g balloon and 400 grams of positive lift. The Balloon Performance calculator estimates an ascent rate of 3.9 m/s and a burst altitude of 30,280 ft.
The flight prediction tool also needs to know the descent rate of your payload at sea level. You can get this data from the parachute product page. We are using the High Altitude Science Near Space Parachute 1.0 m. According to the product page, a 0.6 kg (600g) payload will have a descent rate of approximately 4.8 m/s. At 580 grams, our payload weighs almost 600 grams so we simply select a descent rate of 4.8 m/s.
Step 5 - Run and Analyze
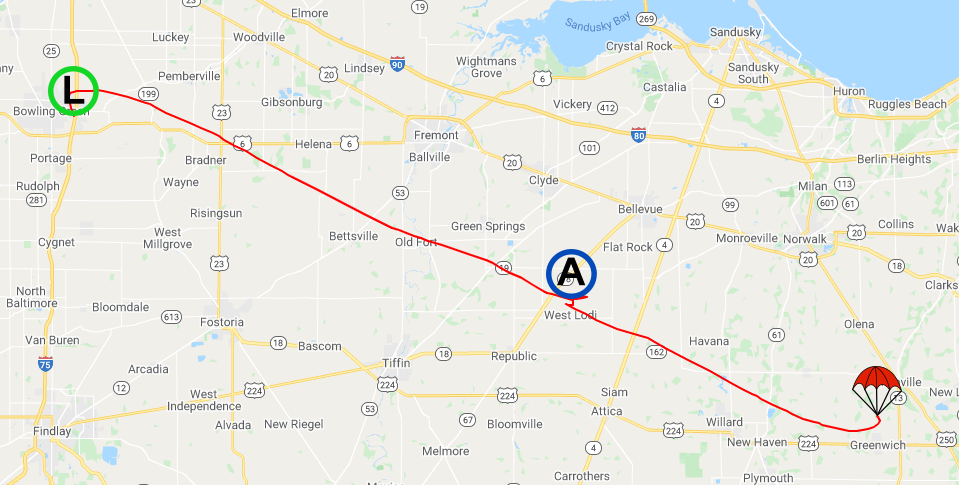
Click “Run” to view the estimated flight path. "L” is for Launch, “A” is for Apogee (highest point in flight), and the parachute designates the landing site. IMPORTANT: If your flight has your payload flying over a populated area, either move your launch site or wait for a day when the wind will take your payload a different direction away from populated areas. Keep in mind that this is an estimated flight path. Give yourself plenty of margin.
Tips
MyFlightPredictor saves your flight prediction inputs when you log out. The next time you log back in, simply click “Run” and the prediction will re-run with the most recent data from the GFS.
If you have flexibility with your launch date, we recommend running a prediction for each date. Simply change the date on the drop-down menu and click “run” for each date. We would then recommend launching on the date where the payload does not fly over populated areas and is estimated to travel the least distance.
Ideas or Questions
If you have any ideas on how we can improve MyStratoTrack.com or if you have any questions, please reach out to support@stratogear.com.

